

Website uptime is important, and every second your site is down means lost visitors and potentially missed revenue. Making sure that you have monitoring in place to check that your site is operating as expected is critical, but you also need to be alerted as soon as something goes wrong. With New Relic, you can easily setup uptime or downtime alerts which notify you if your website experiences an issue or can’t load content on your site. Regardless of whether you’re using a CMS like WordPress, an e-commerce platform like Shopify, or running your own web server – uptime monitoring and alerts are easy to configure and best of all, completely free with New Relic’s free tier.
In this tutorial, we will walk through how to setup a website downtime alert for free using two tools, called New Relic Synthetics and New Relic Alerts & AI. We will use both of these tools to check if the website is online (Synthetics) and then if the website is down, send an alert (Alerts). The first thing we need to do is create a New Relic account.
Time needed: 20 minutes
For this guide, we’ll assume that you haven’t created an account on New Relic yet or setup an existing monitor. If you already have an account, you can skip Step 1.
- Create your New Relic Account
Navigate to New Relic and click on the “Sign Up” button. In this signup flow, you’ll be asked to enter the name of your account, your work email (which can be a Gmail account), and the location that you’d like your data stored on New Relic services.

Note: During the New Relic signup process, you’ll be asked where you want your data stored (right now the options are Europe and United States). It makes no difference what location you choose – you do not need to choose the location that is closest to you – this option is strictly for organizations that are bound by EU data privacy laws that require their data to be hosted on servers located in the EU. Feel free to select either option during setup. - Setup your first Synthetics Monitor
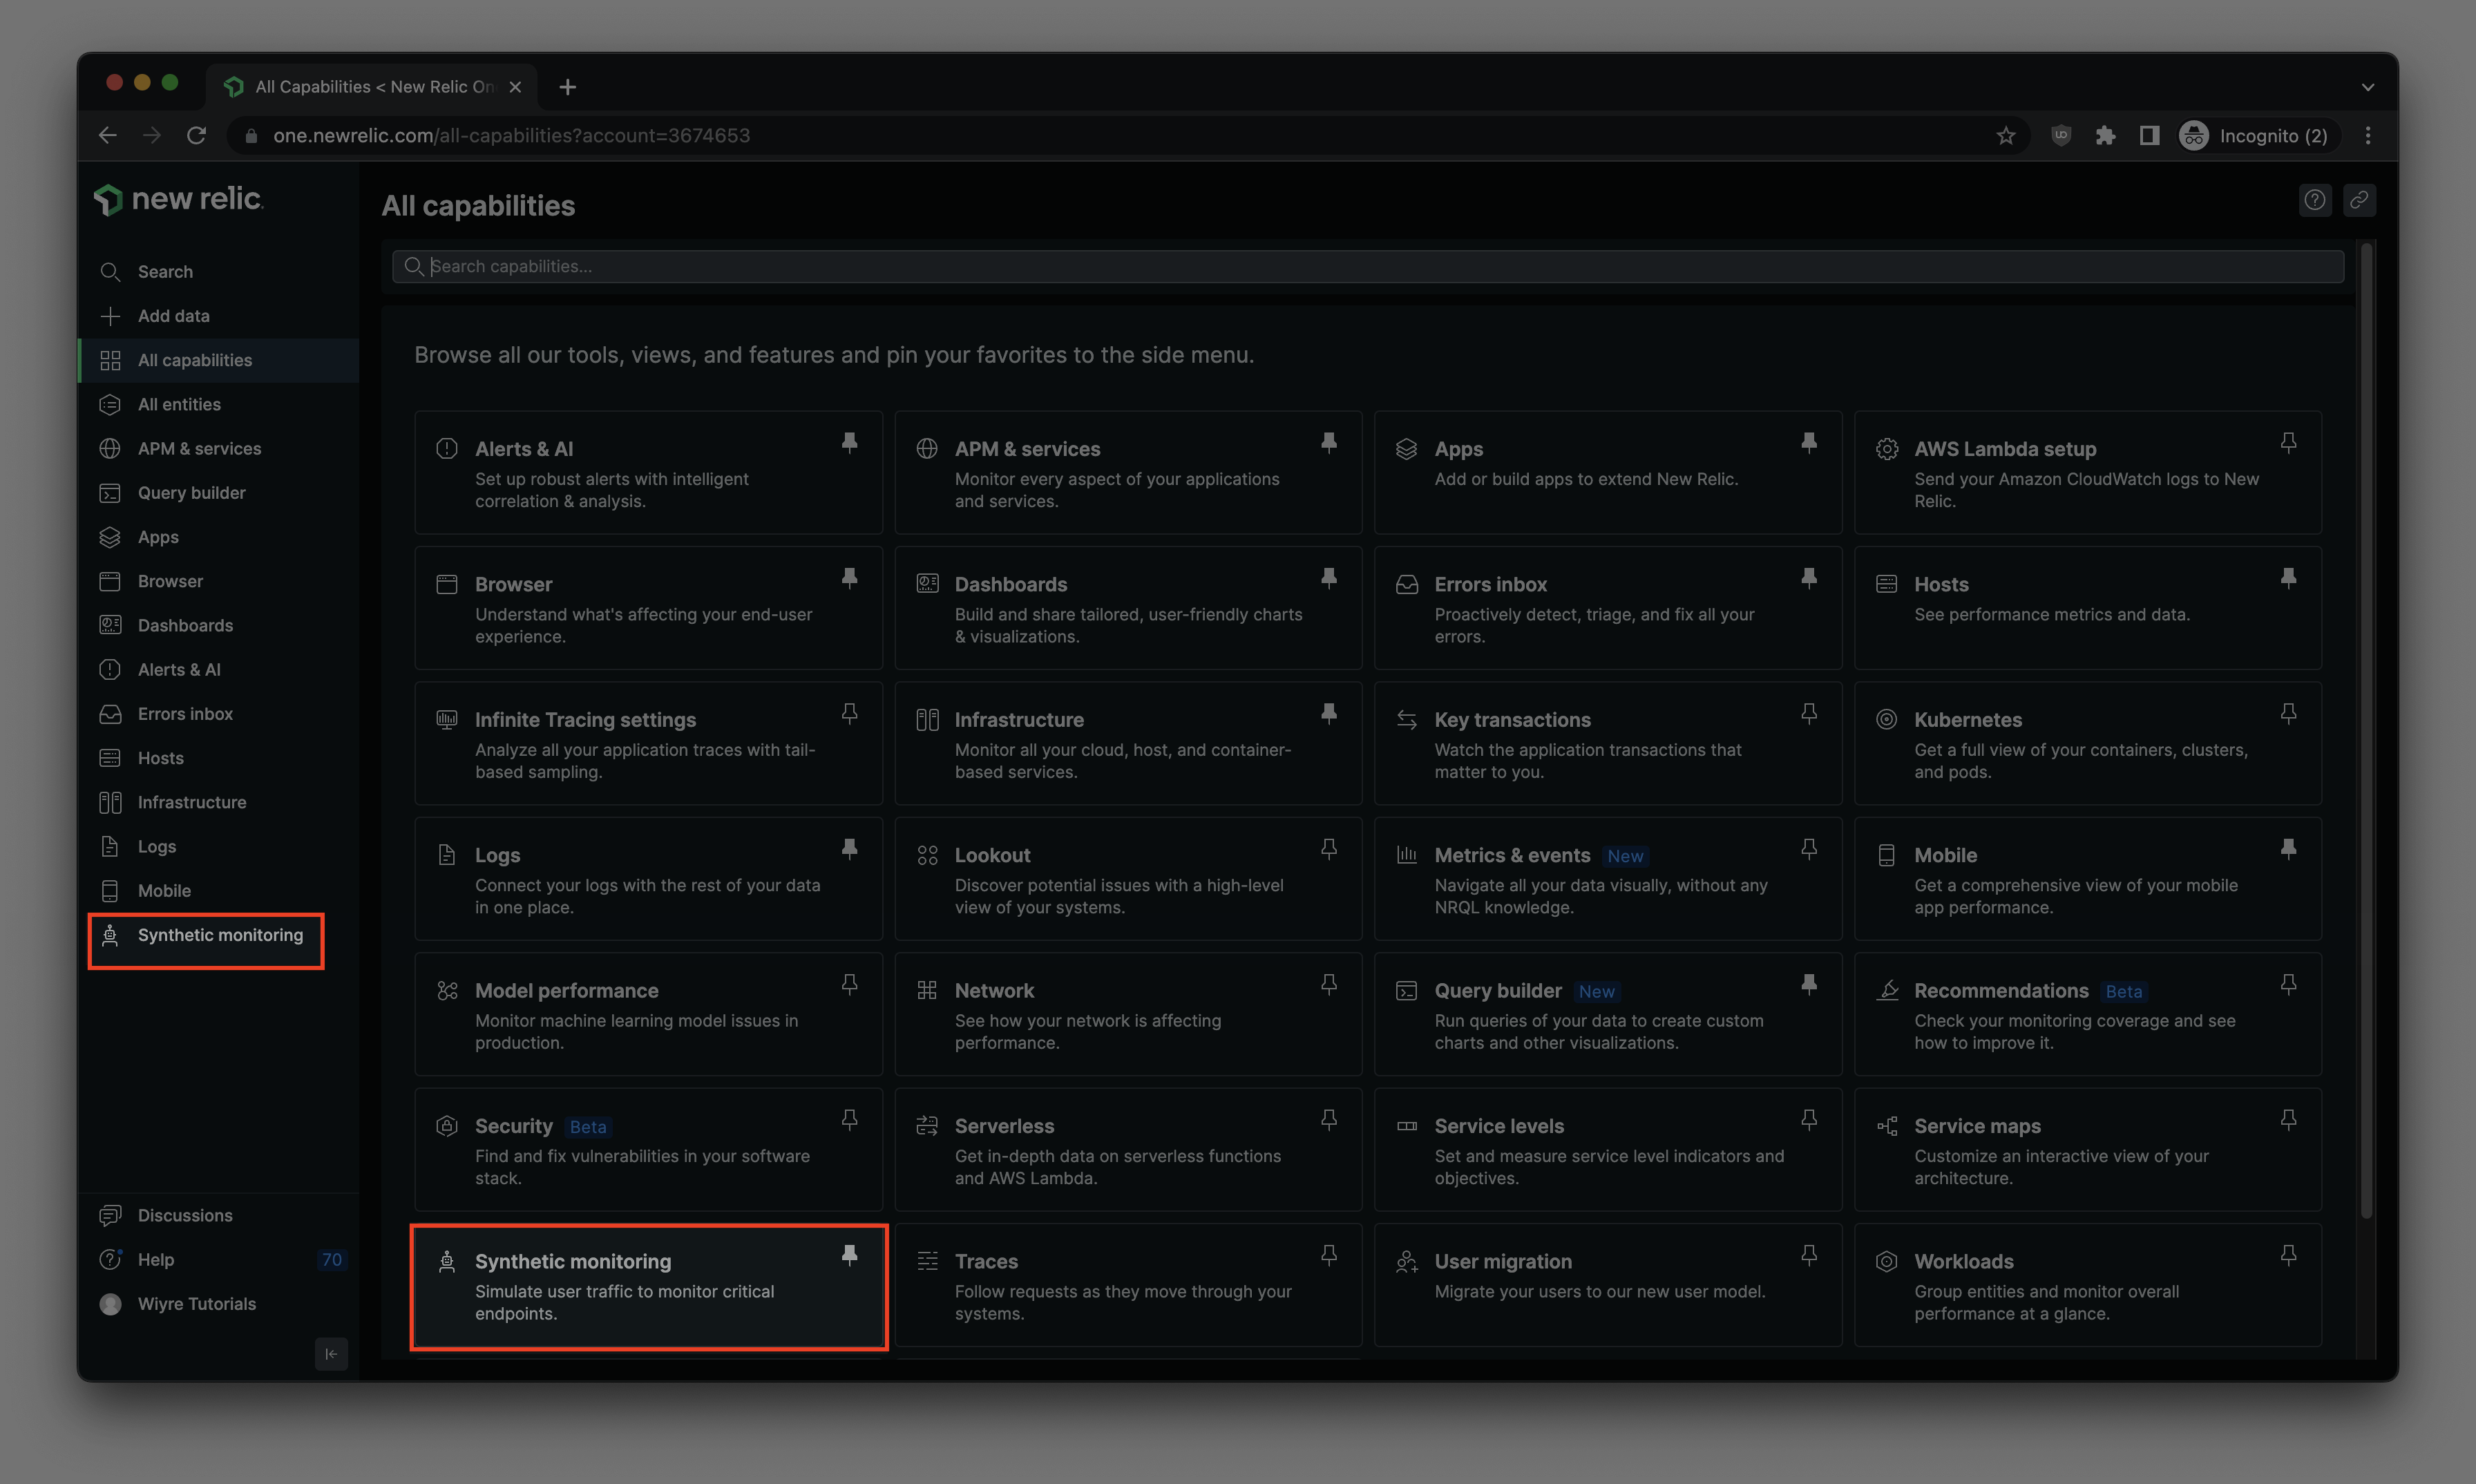
A Synthetics Monitor gives you the ability to “ping” your site at a defined time internal to check and see if it responds. If your site doesn’t respond at all, or doesn’t respond with the content or text that you’re expecting, it could indicate a website issue that you should look into. Setup a Synthetic Monitor by clicking on the “Synthetic monitoring” option in the left hand side of the page, or from the bottom of the “All Capabilities” page.
- Choose your monitor
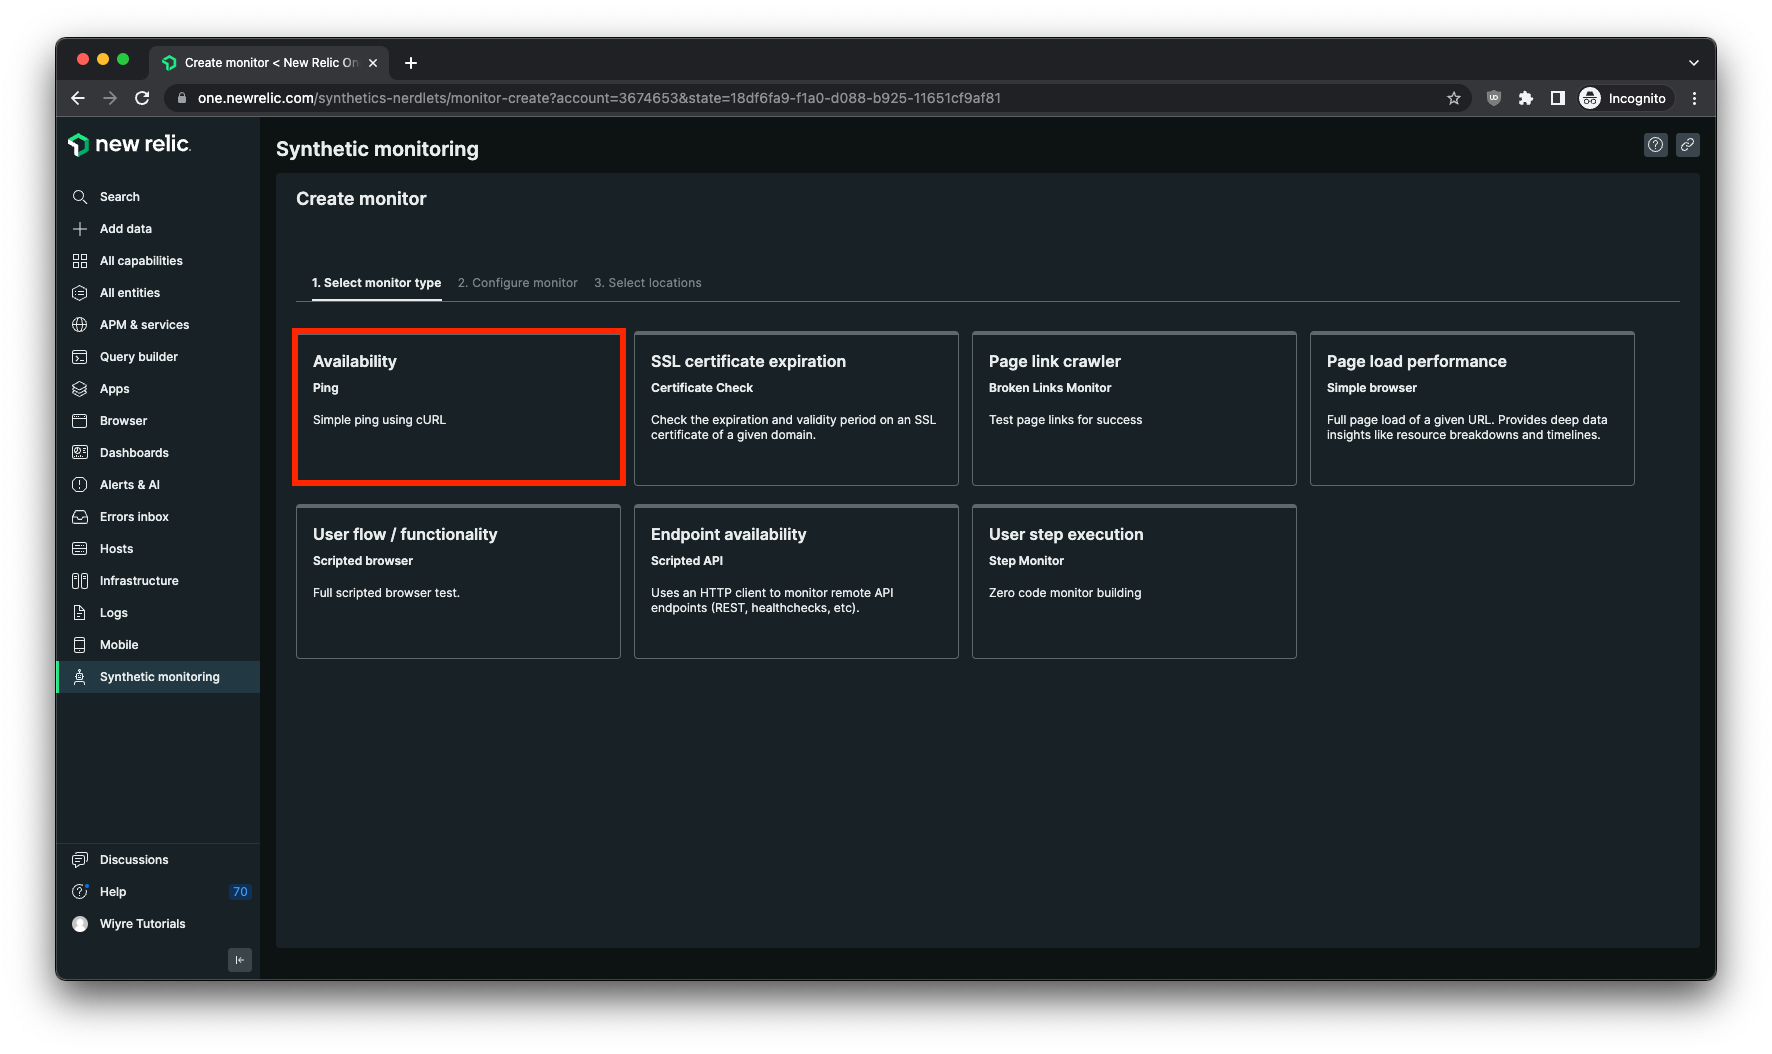
In the Synthetics monitor section, you’ll be asked what type of monitor you want to create. We’ll be using the “Availability” (Ping) Monitor for this tutorial. Click on the monitor name to get started.
- Configure your monitor settings
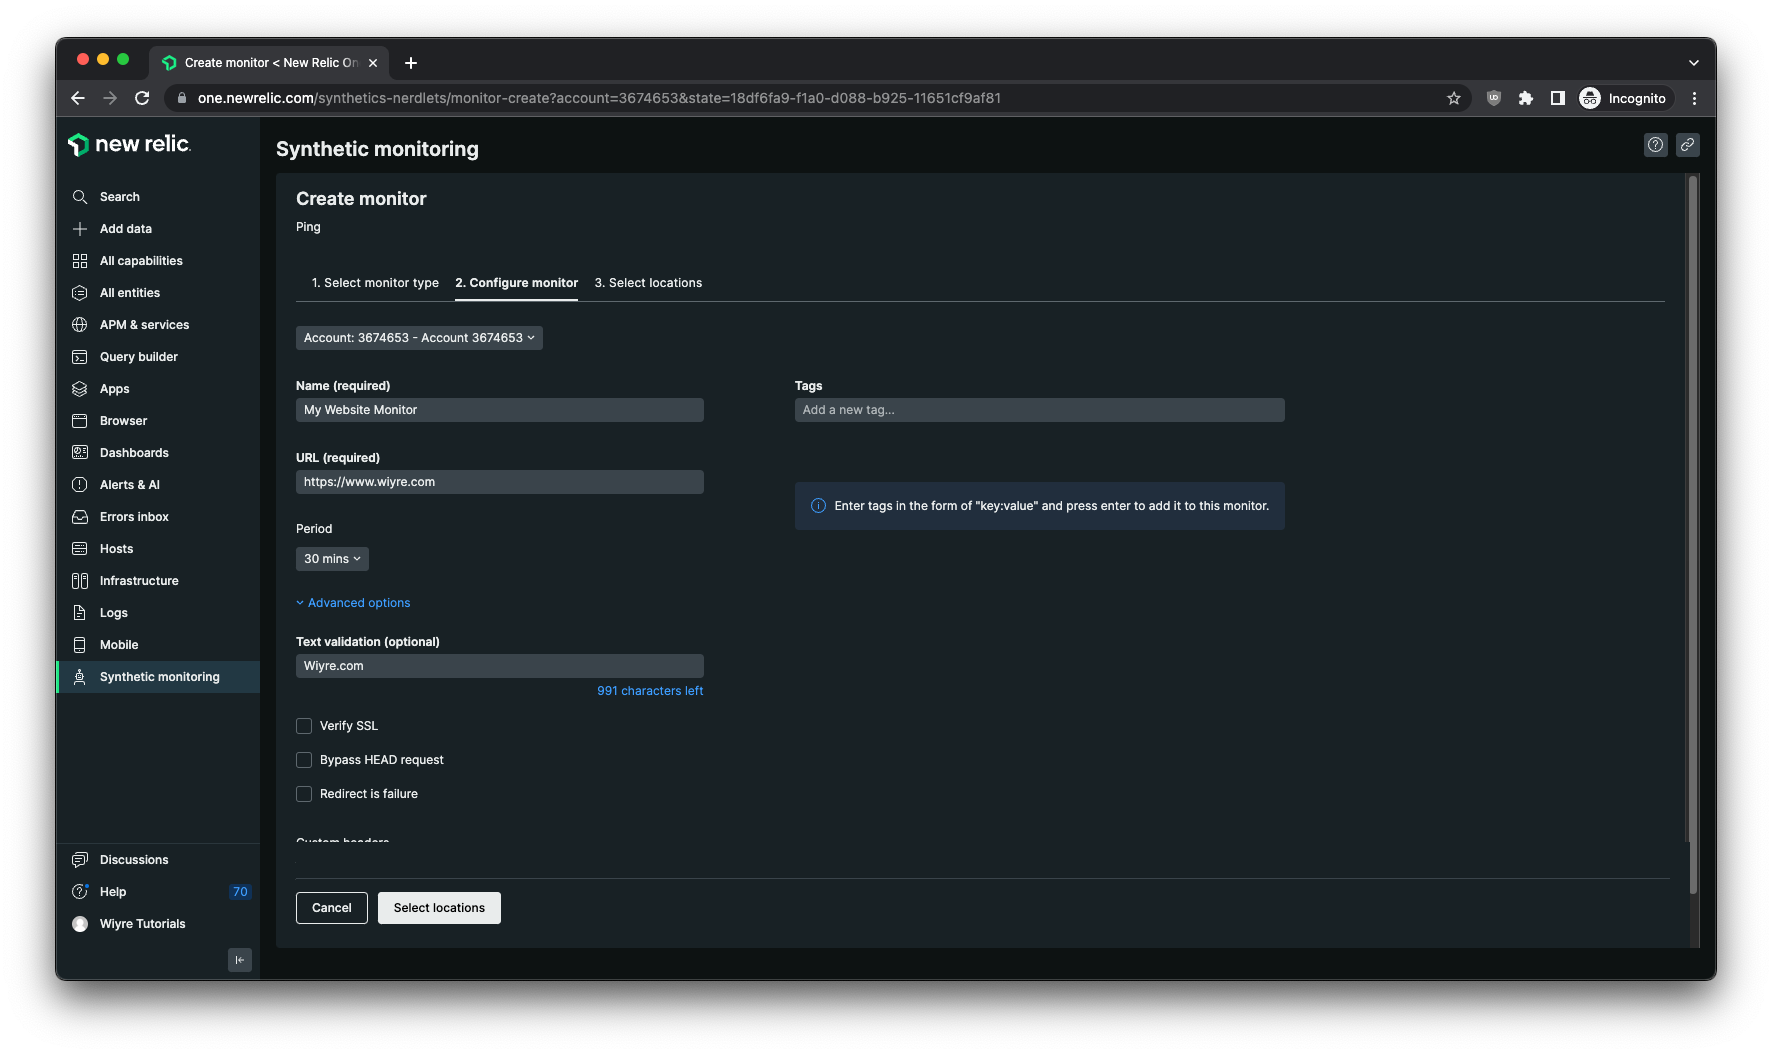
In the “Create Monitor” options you’ll want to specify a monitor name, a URL that you’d like to check (this would be your website), and the time period that you want your site to be checked. Set your period to a reasonable timeframe, I usually choose around 30 minutes. This also ensures that you stay within the free tier and don’t have to pay for a bunch of checks per month.
You also have the ability to select advanced options, if you choose. One advanced option is “Text Validation”. Text validation ensures that a specific piece of text (like the text in a footer, or a product or article title that always appears on your homepage page) appears each time that New Relic performs a check. This is a nice feature because it allows you to confirm that the website loaded the entire page including the piece of text that you specify.
There are other advanced options, such as Verify SSL and whether to treat a 302/301 redirect as a failure, but we are going to leave those options unchecked for now and click on “Select Locations”. - Select your monitor locations
On this page you’ll select the locations New Relic will check your website from. The locations can be all locations on this page, or a smaller subset of just a few. To make sure you don’t hit the maximum checks allowed for the free tier, only select 3-4 locations at a time for each monitor. Click on “Save Monitor” once you’re finished.
- Create your new alert condition
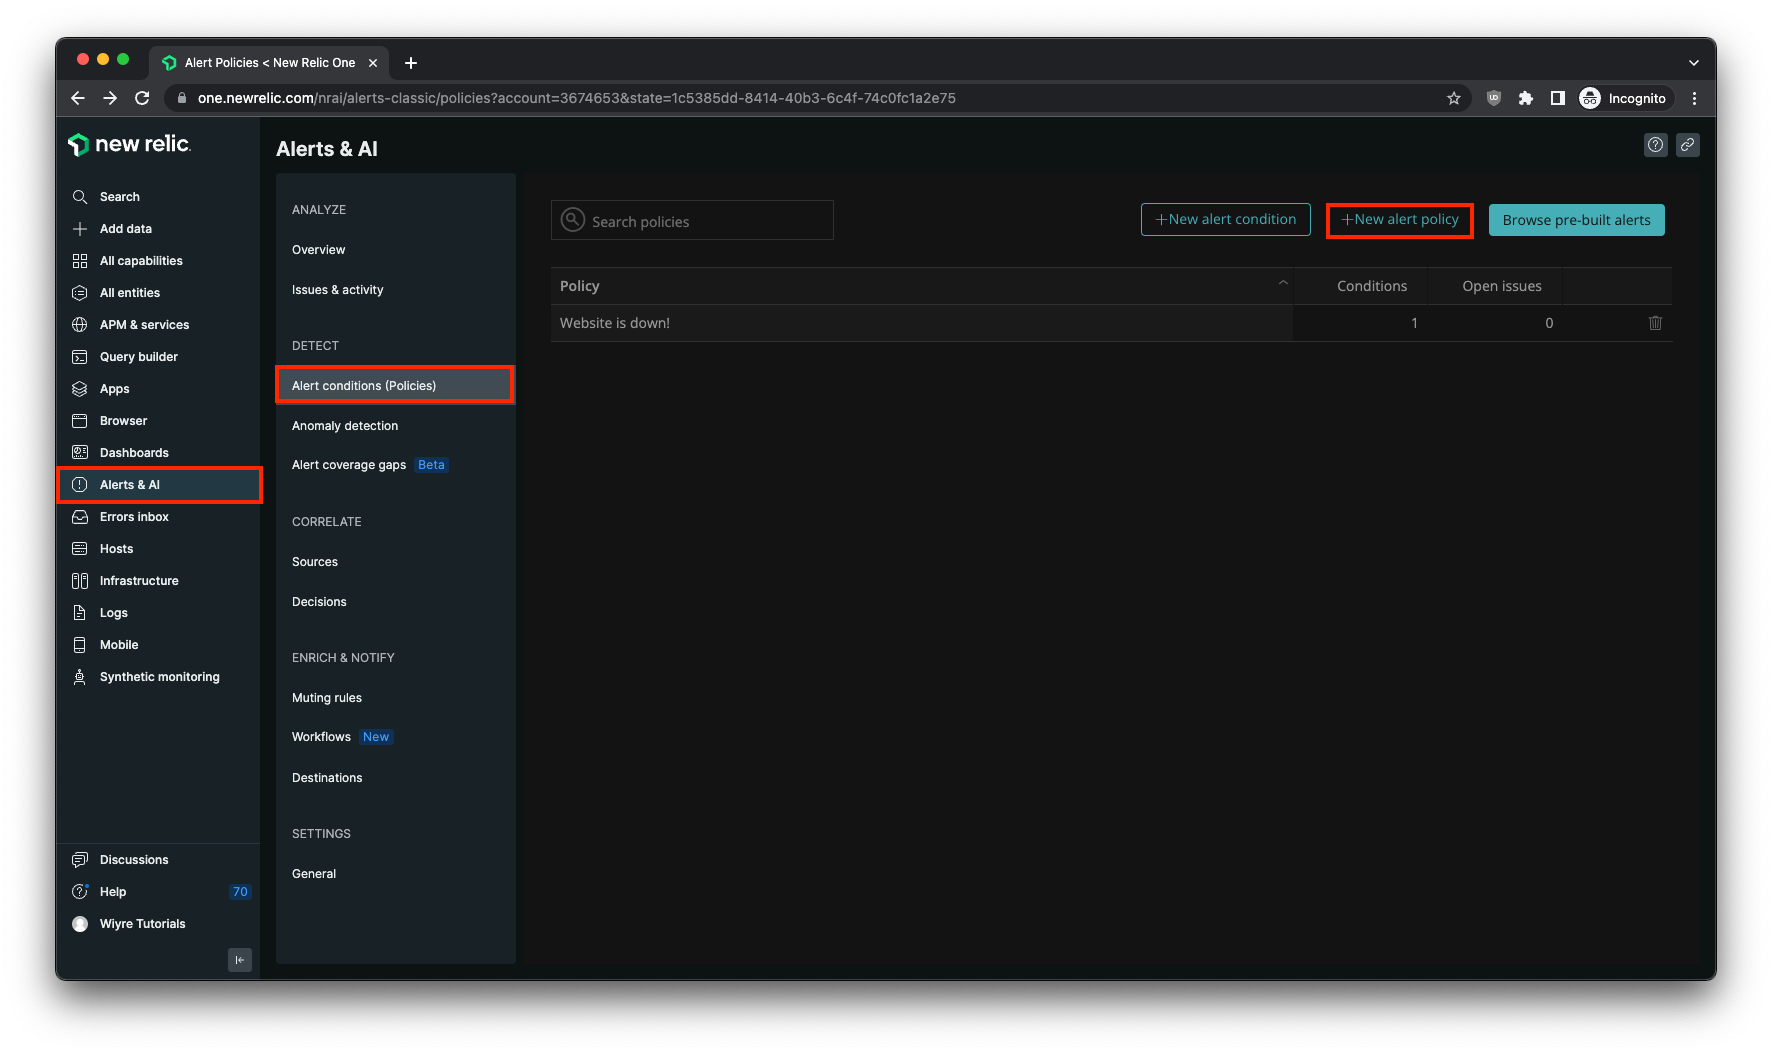
Once your monitor is setup, the next step is to create an Alert Condition. To do so, click on “Alerts & AI” or search for Alerts in the search box on the left hand side of the page. In the Alerts & AI page, click on “Alert conditions (Policies)” and select “New Alert Policy”.
Your alert policy can be configured to group one issue per policy, or one issue per condition (if you have multiple websites all down at the same time, for example). There is also the ability to select “One issue per incident”, but this is not recommended because it will result in many notifications. Once you’ve added details about the alert policy, click on “Set up Notifications”. - Select your notification type
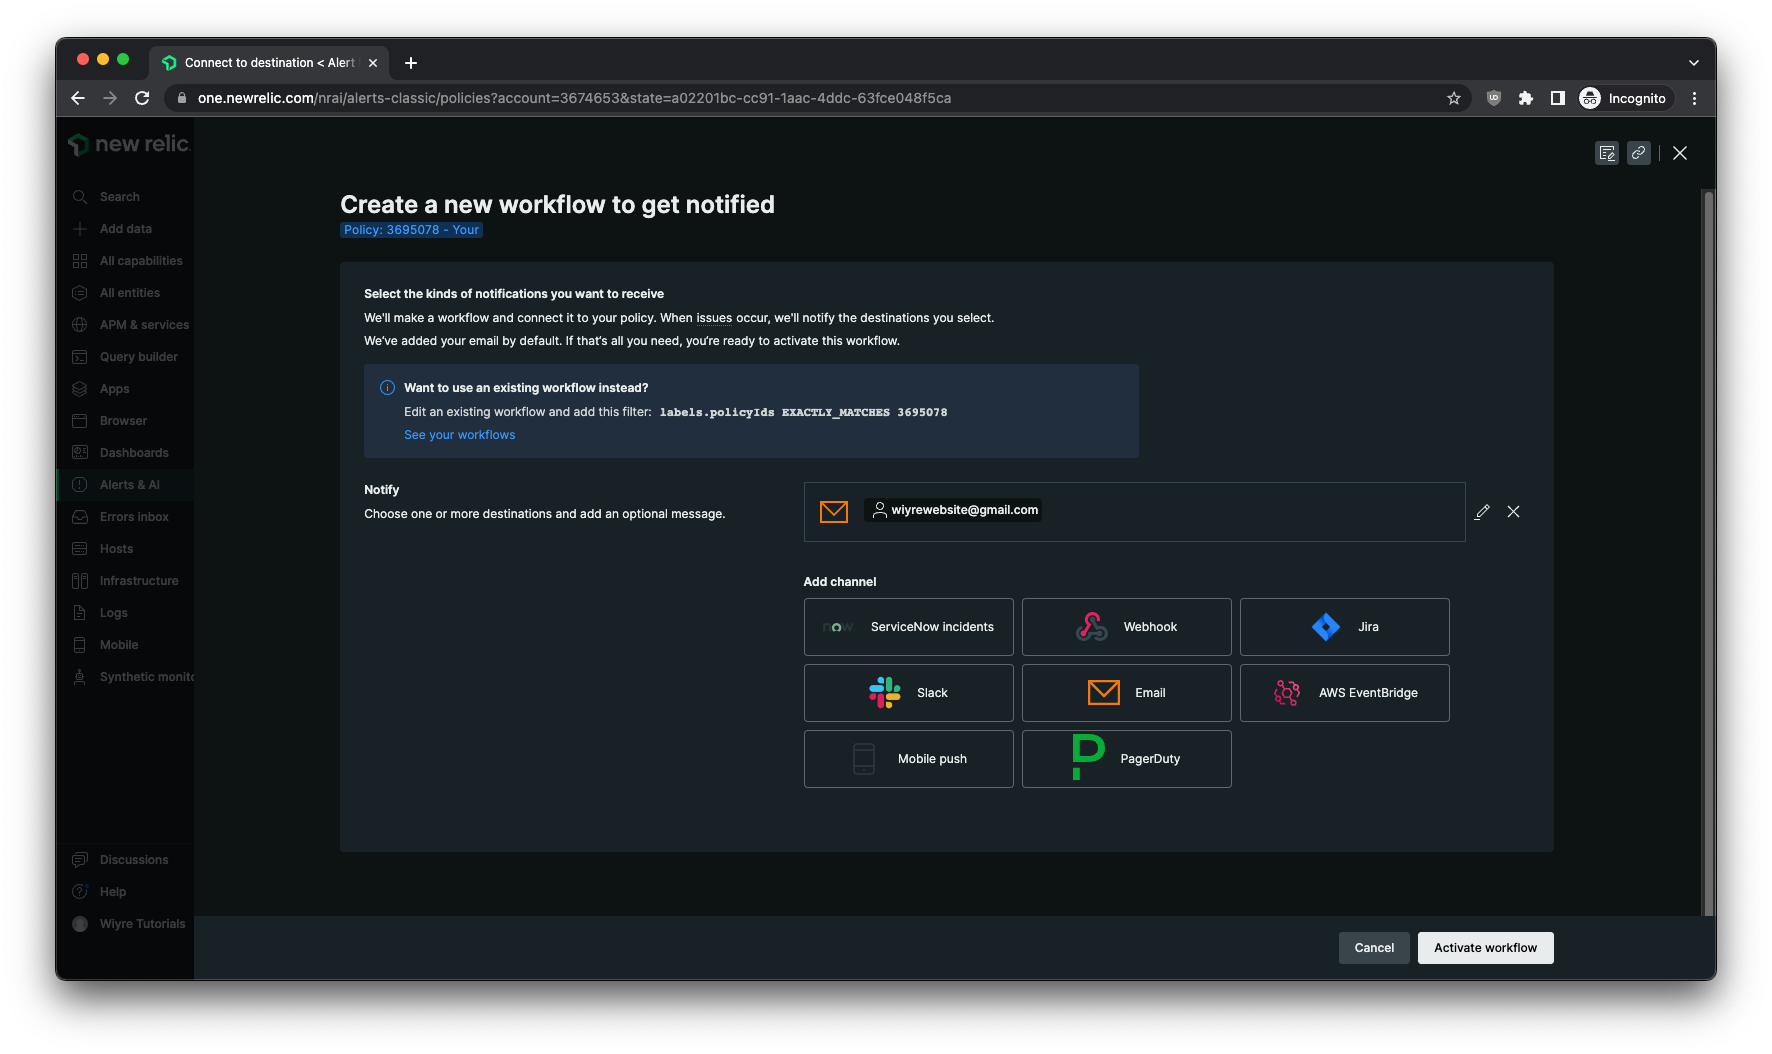
On the next page, you’ll be asked what type of notification you want to receive if the alert you’ll setup next is triggered. For this purpose of this tutorial, we will be using the “Email” notification option. There are more advanced options that allow you to post in a Slack channel, create a ServiceNow incident, or send a push notification to your mobile phone. Once you’ve selected your notification channels, click on the “Activate workflow” button.
- Create your alert condition
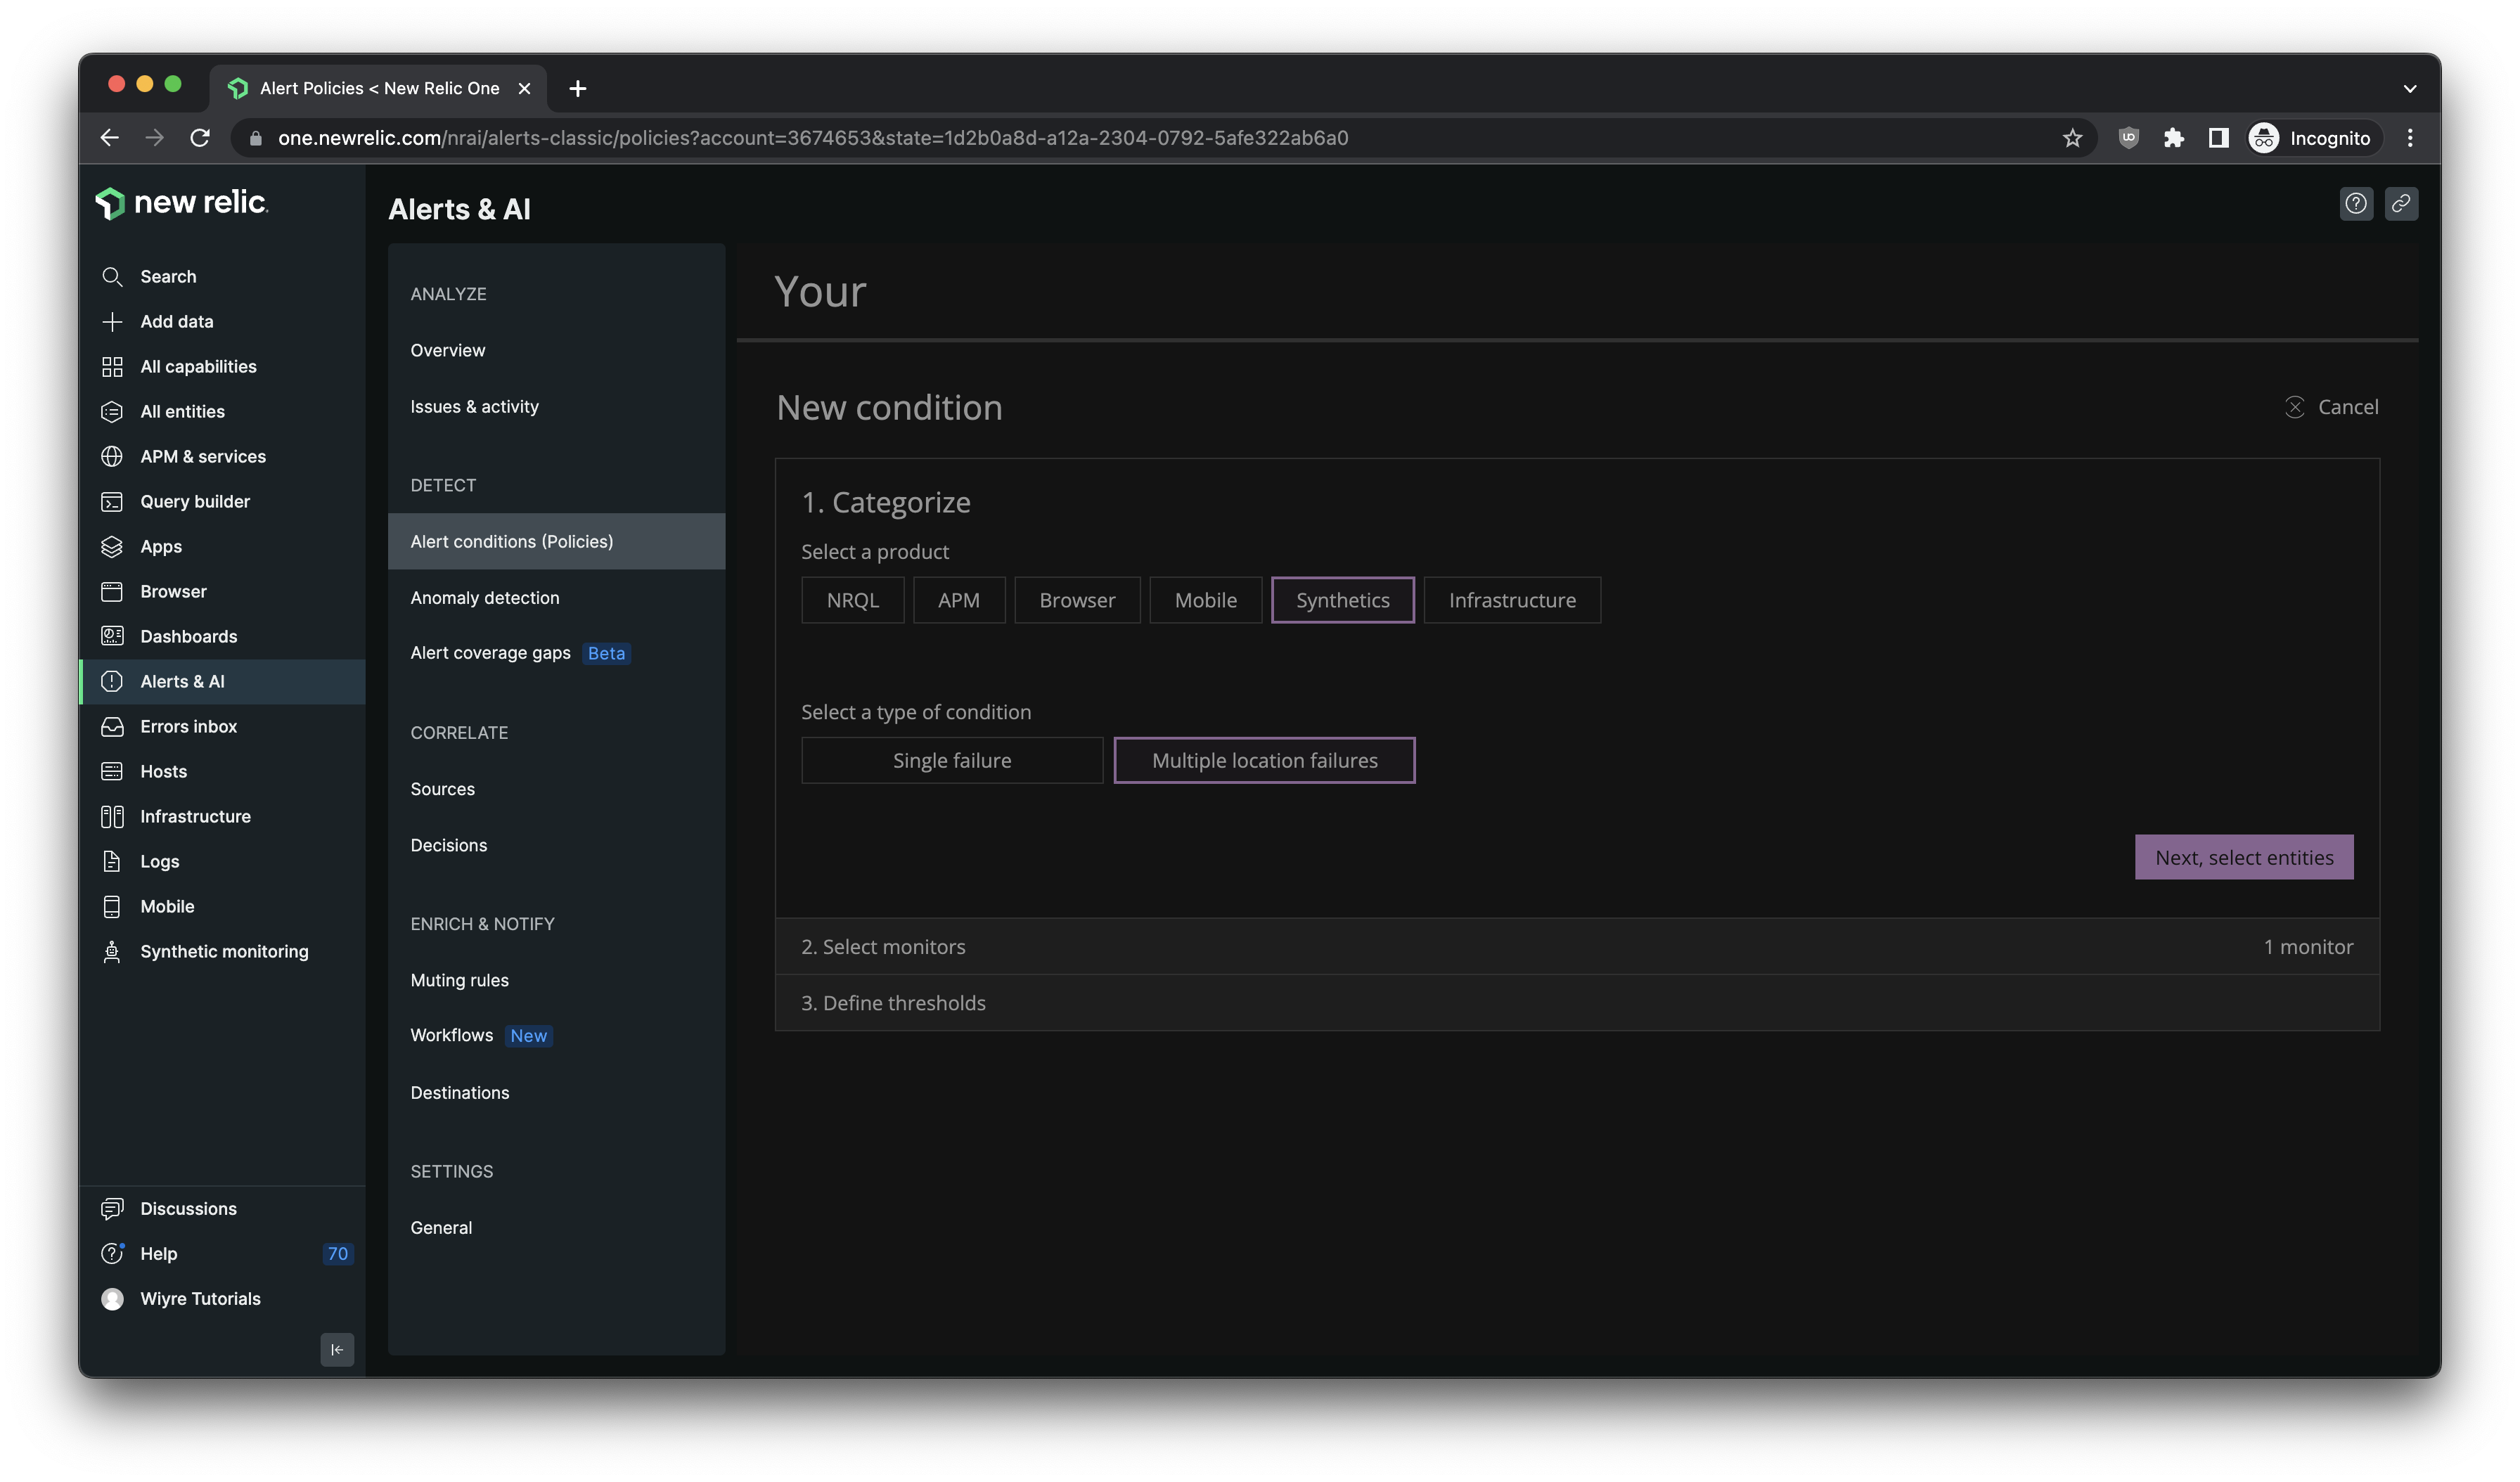
Click on the “Create a condition” button once you save your workflow, and you’ll be presented with a page that allows you to first select a product. We’re going to choose the “Synthetics” button, and then select “Multiple failures”. The reason we are selecting multiple failures is because there is occasionally issues that are outside of your control which cause New Relic to be unable to check your site, so some of your monitor locations will fail randomly. In these cases, we don’t want to be alerted for a one-off issue. We do however want to be alerted if multiple monitors are reporting that the site is down or unreachable.
On the “Select Entities” option, select the Synthetics monitor that you just created. - Define your alert thresholds
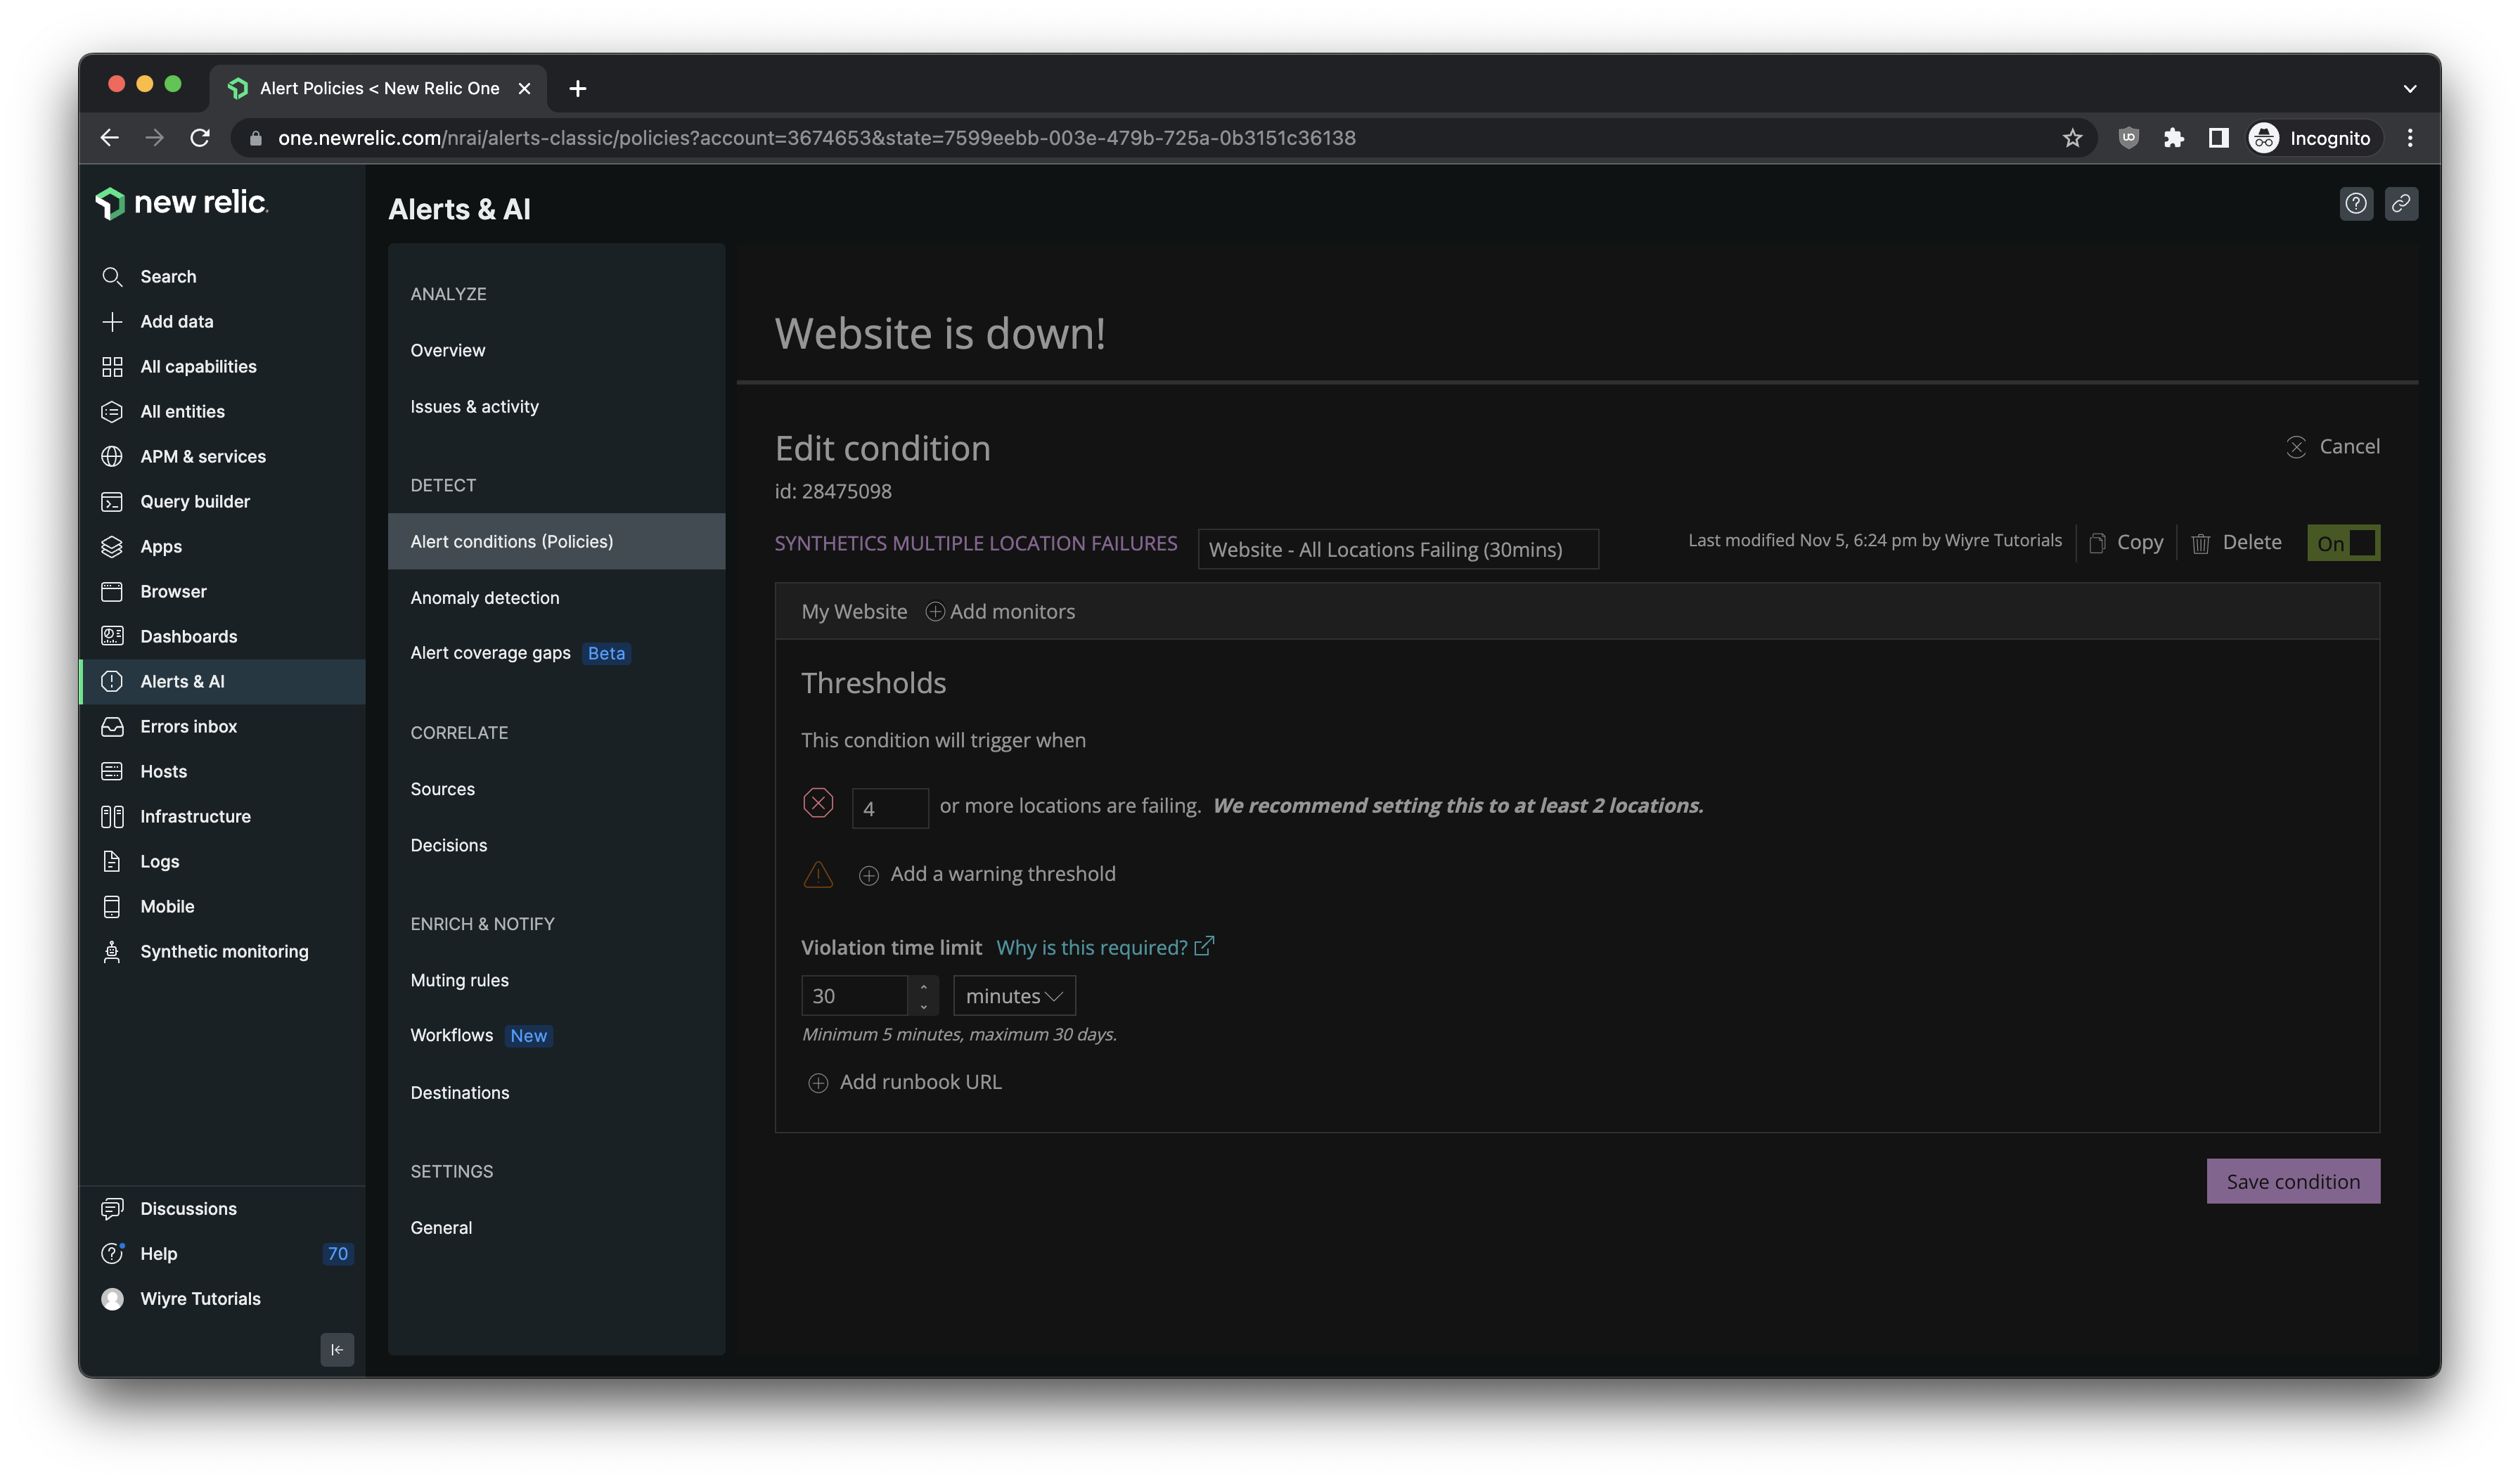
The final step is to define your alert thresholds. I recommend setting at least 2 locations, and setting your violation time limit to 3 days. There’s more information located here if you want to learn more about how time violations work. The final step is to name your condition and click on “Create condition”.

Validate that your Alert is working correctly
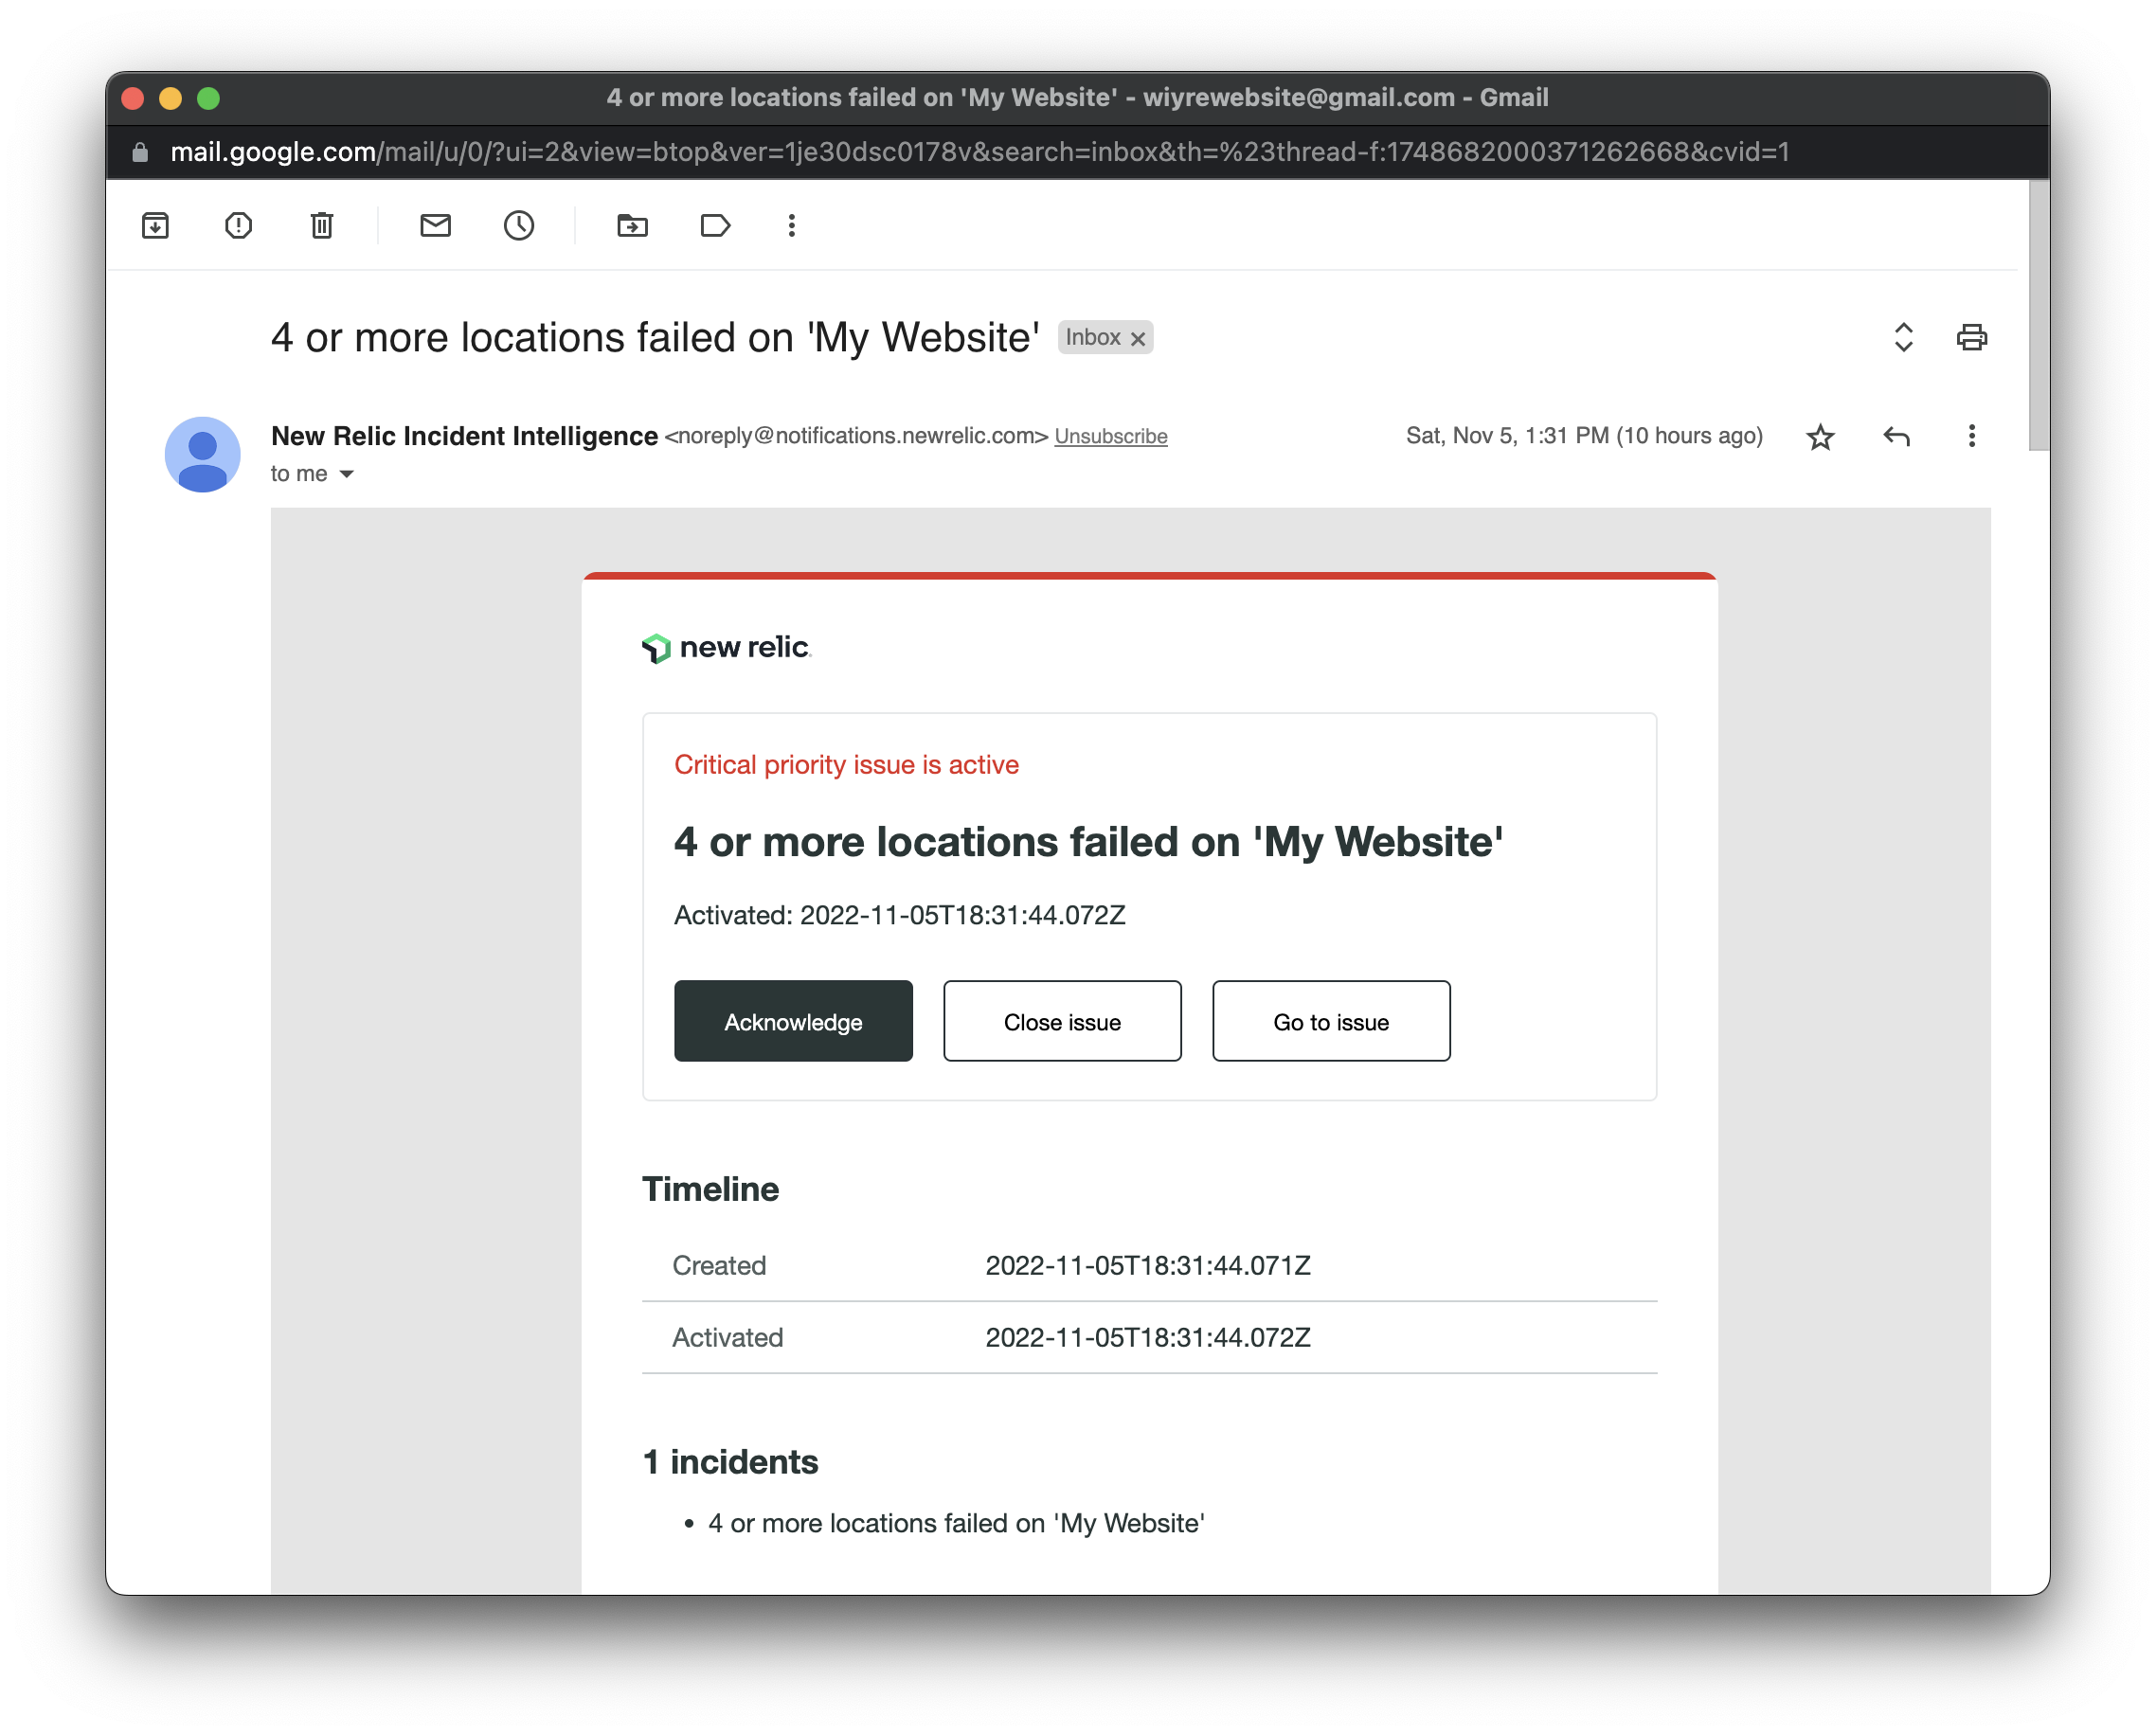
Once you’ve saved your alert, you’ll probably want to check and make sure that your alert is working correctly. The easiest way to do this is to simply change your Synthetics monitor to check a webpage that doesn’t exist on your site, and wait for your alert go off (since you’re asking New Relic to check a page that doesn’t exist, it will fail every time, because it won’t be able to find the page). Once it fails and your alert thresholds are triggered – you’ll receive an email that gives you information about the alert and the ability to acknowledge the alert or close the alert.
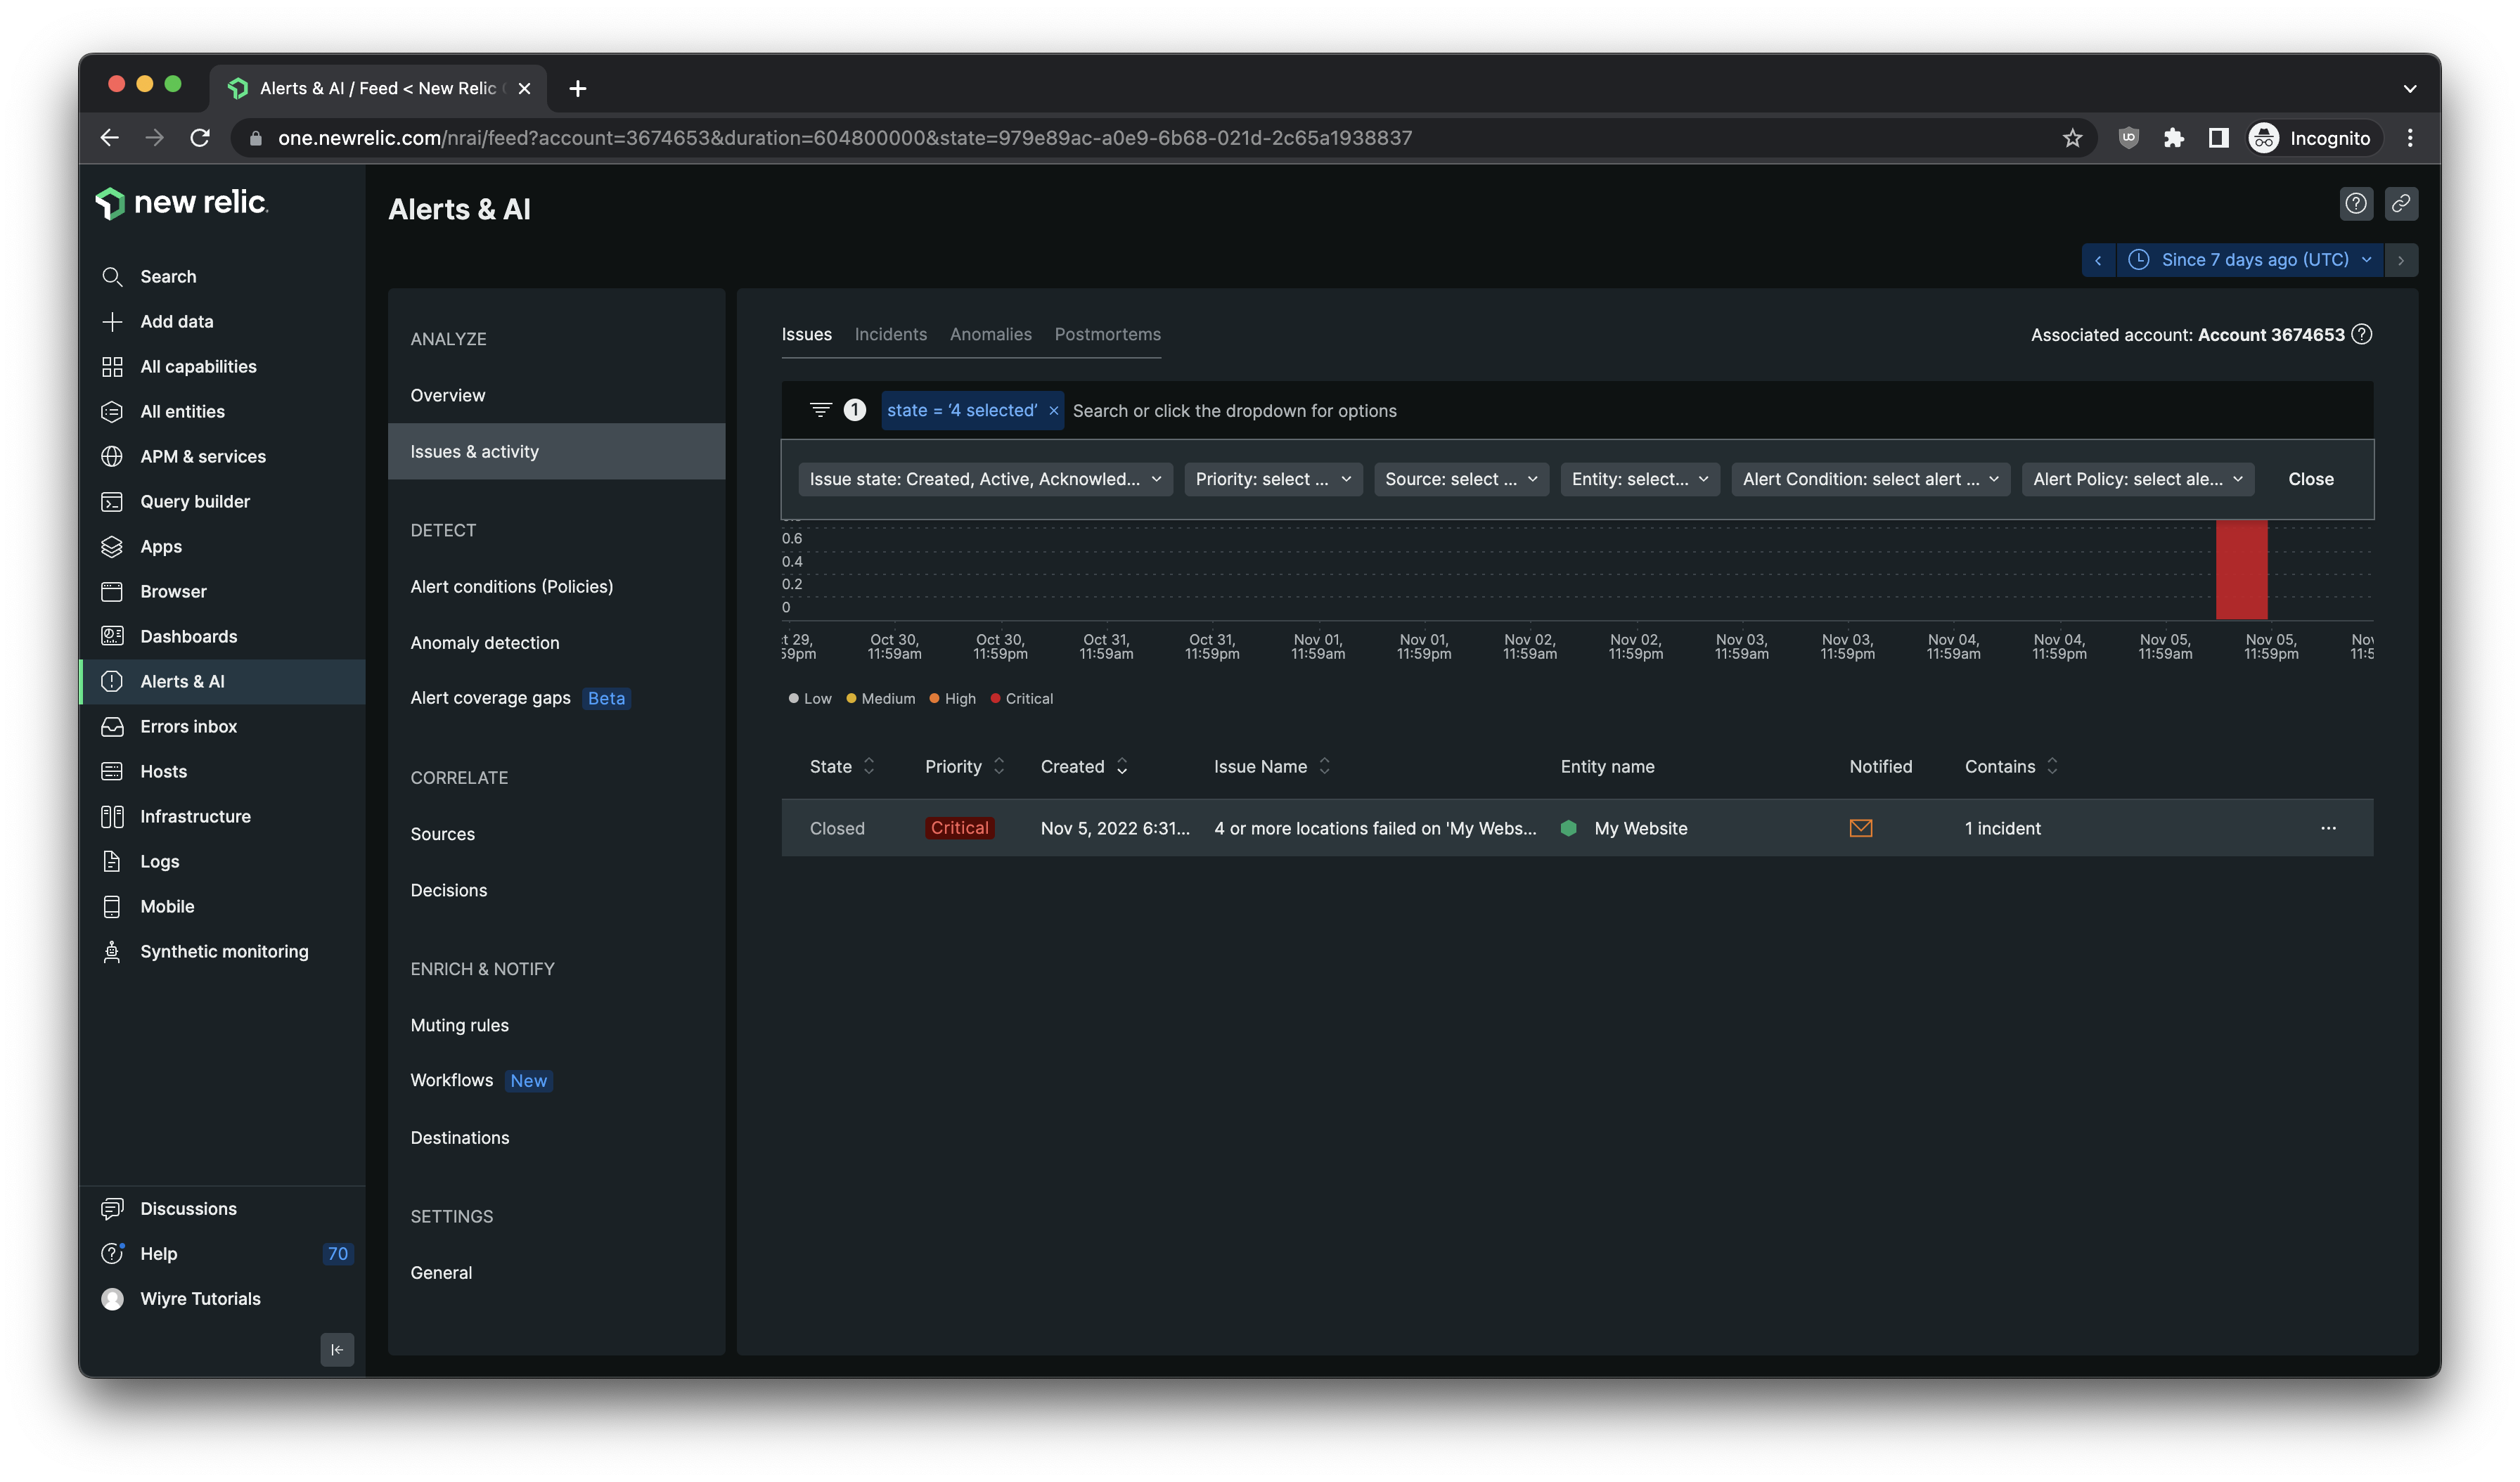
Success! Once you know your alert is working correctly, change your monitor settings back to the values you prefer, and close the alert. You can see all of your alerts (even the ones that have been closed or acknowledged by other people, if you’re part of a team) in one place on the New Relic alerts page:
With this monitor and alert combination, you can be at ease knowing that you’ll be alerted the moment something goes wrong on your website. The next step is to setup monitoring for all websites or online services that you work with – or setup an advanced monitor to check for specific user flows, or create fully scripted browsers that perform a variety of actions during the check.